Main listed companies in dry-type transformer industry:At present, the listed companies in domestic dry-type transformer industry mainly include (688,676), (600,089), (600,550) and (002,112).
Core data of this article:Development history, supply and demand, price, industrial chain, market scale, regional pattern, enterprise pattern and development trend of dry-type transformers.
1. Overview of dry-type transformer industry
— — Definition: It has obvious advantages in low noise, energy saving, fire prevention and long service life.
Dry-type transformer refers to a transformer whose core and winding are not immersed in insulating oil. Like ordinary transformer, it is mainly composed of core and winding. It realizes cooling by air convection, and has the characteristics of flame retardancy, fire prevention, explosion prevention, environmental protection, safe and reliable use, simple and convenient installation and maintenance, and can go deep into the load center.
Compared with the comprehensive technical and economic performance of low noise, energy saving, fire prevention, saving civil construction cost, operation and maintenance management fee and a life of up to 30 years, dry-type transformers show their obvious advantages, so they are widely used in high-rise buildings, subways, railway stations, airports, hospitals, petrochemical enterprises and mine interiors.
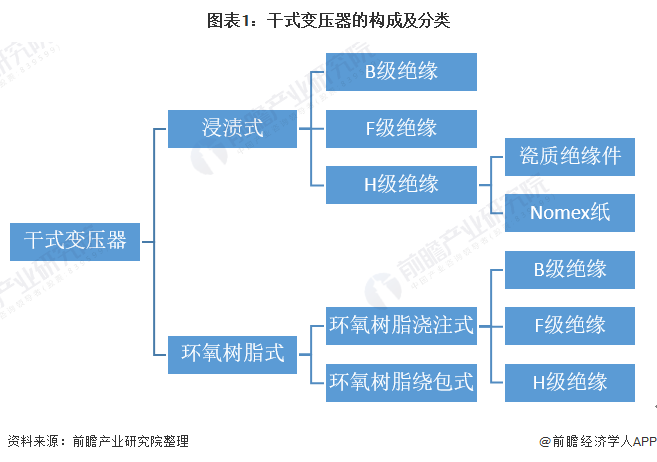
From the perspective of manufacturing technology, dry-type transformers mainly have two types: immersion type and epoxy resin type, among which epoxy resin type is divided into epoxy resin casting type and epoxy resin winding type.
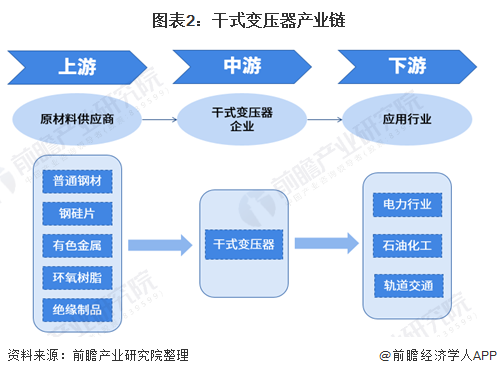
2) Analysis of industrial chain of dry-type transformer industry: There are many raw materials in the upstream.
The upstream of dry-type transformer industry mainly includes ordinary steel, silicon steel sheet, nonferrous metals such as copper and aluminum, and epoxy resin as the packaging material of dry-type transformer, while the downstream industries mainly include petroleum and petrochemical, power grid construction, urban rail transit and other industries.
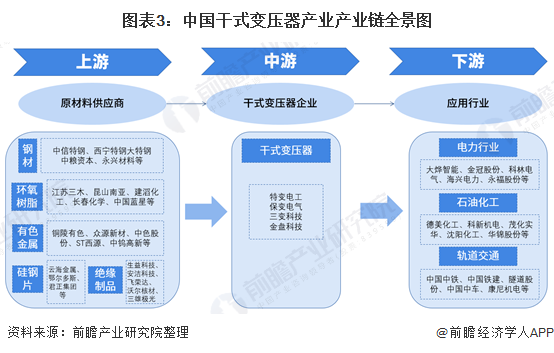
The upstream of dry-type transformer needs more raw materials, and the enterprises involved mainly include enterprises in steel industry, such as,, and so on; Silicon steel sheet industry,,, etc.; Non-ferrous metal industry,,, etc. Jiangsu Sanmu and Kunshan South Asia in epoxy resin industry.
The main listed companies in the midstream dry-type transformer industry are TBEA, Baobian Electric, Sanbian Technology and Jinpan Technology.
The downstream application industries mainly involve power industry, petrochemical industry and rail transit industry.
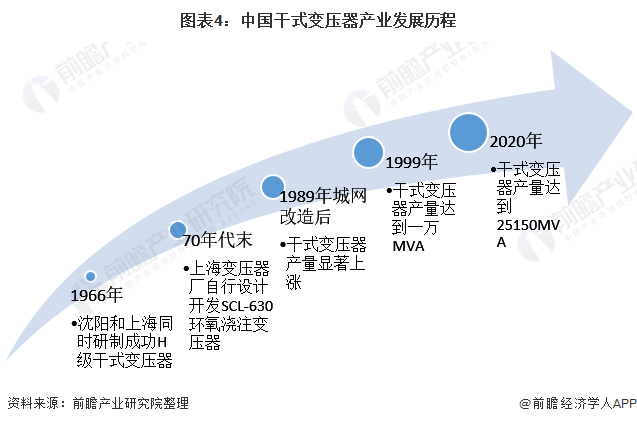
2. Development course of dry-type transformer industry in China: it began to grow rapidly after 1989.
In China, ZSG-1800/10 air-cooled H-class dry-type transformer was successfully developed by Shenyang Transformer Factory in 1966, SG3-800/10/1.2/0.4 self-cooled H-class dry-type transformer was successfully developed by Shanghai Transformer Factory, and SCL-630 epoxy casting transformer was designed and developed by Shanghai Transformer Factory at the end of 1970s.
In terms of output, the output of dry-type transformers in China has increased significantly since the second meeting of urban network transformation in 1989. Since the 1990s, it has increased by about 20% every year. In 1999, the total output has approached 10,000 MVA (which has greatly exceeded the forecast of 45,000 MVA 10 years ago), while in 2002, the total output reached 20,000 MVA, and in 2004 it reached 32,000 MVA.
3. Upstream supply of dry-type transformer industry in China: Silicon steel sheet is the main raw material of dry-type transformer.
— — Ordinary steel production: steel production began to pick up.
In terms of output, China’s steel output has been higher than that of crude steel and pig iron for a long time. From 2011 to 2014, the output of steel, crude steel and pig iron in China showed an increasing trend year by year; In 2014, China’s steel output increased to 1.125 billion tons, setting a historical record; In 2015-2017, due to the national supply-side reform, de-capacity and the decline in the growth rate of real estate investment, the output of steel, crude steel and pig iron in China declined compared with 2014;
However, with the steady development of the world economy in 2018, China’s steel output began to pick up. In 2020, China’s steel, crude steel and pig iron output were 1.325 billion tons, 1.064 billion tons and 888 million tons respectively, with year-on-year growth rates of 9.96%, 6.83% and 9.77% respectively.
From 2021 to October, the national output of pig iron, crude steel and steel products were 734 million tons, 87,700 tons and 112,200 tons respectively, up by -3.2%, -0.7% and 2.8% respectively.

From 2008 to 2014, the production and sales rate of China’s steel industry was mostly between 99% and 100%, close to 100%, reflecting that China’s steel industry was in a state of oversupply. In 2014-2015, after the adjustment of domestic industrial structure, the production and sales rate declined. From 2016 to 2018, China’s production and sales rate gradually increased. According to the data of the National Bureau of Statistics, in 2020, China’s steel production and sales rate will be 99.95%, and steel supply and demand will be relatively balanced.
According to the statistics of China Iron and Steel Industry Association, from January 2020 to May 2021, China’s comprehensive steel price index showed a downward trend, with a minimum value of 132.36 in May 2021.

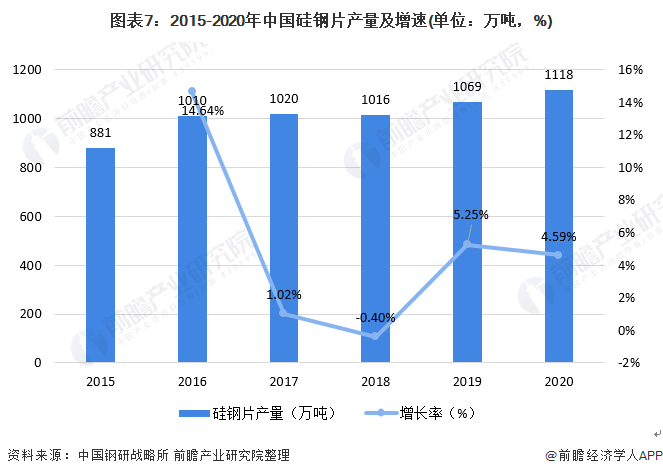
2) output of silicon steel sheet: the output in 2020 will be nearly 12 million tons.
From 2015 to 2018, the output of silicon steel sheets in China increased from 8.809 million tons to 10.161 million tons. According to the public data of Electrical Steel Branch of China Metal Society, in 2020, the output of silicon steel sheet in China was 11.1811 million tons, including 9.6049 million tons of non-oriented electrical steel and 1.5762 million tons of oriented electrical steel.
The silicon steel sheet used in dry-type transformer core is oriented silicon steel. Since 2020, the price of oriented silicon steel in China has been declining continuously. As of May 2021, the price of oriented silicon steel in China is about 13,750 yuan/ton.

3) Output of non-ferrous metals: The output of aluminum reached 44.78 million tons in the first three quarters.
From 2014 to 2020, the refined copper production in China showed an overall growth trend, and the domestic refined copper production capacity expanded significantly. At the same time, the stable, sustained and rapid development of China’s industrial aluminum profile national economy and high technology has promoted the rapid development of China’s aluminum smelting and aluminum profile processing industry.
From 2014 to 2020, the output of refined copper in China is increasing year by year. In 2020, the output of refined copper in China is 10.09 million tons. In the first three quarters of 2021, China’s refined copper output reached 7.76 million tons.
In terms of aluminum production, from 2014 to 2020, the output fluctuated. In 2020, the cumulative aluminum production in China reached 57.793 million tons, and in the first three quarters of 2021, the aluminum production in China reached 44.78 million tons.

According to the copper price index data of China Hardware & Electrical Index, the domestic copper price index showed a downward trend at first and then an upward trend from 2012 to 2020. From 2012 to 2016, the copper price index decreased year by year. After 2017, the copper market price trend fluctuated little. As of March 31st, 2021, the copper price index in 2021 was 92.07.
The aluminum price index changes in a "W" shape. In 2012-2015, the domestic aluminum price index was basically above 93. Since the price index dropped sharply in 2017, the aluminum price index was below 90 in 2017-2018. In 2019, the aluminum price index began to rise. As of March 31st, 2021, the aluminum price index was 106.62.
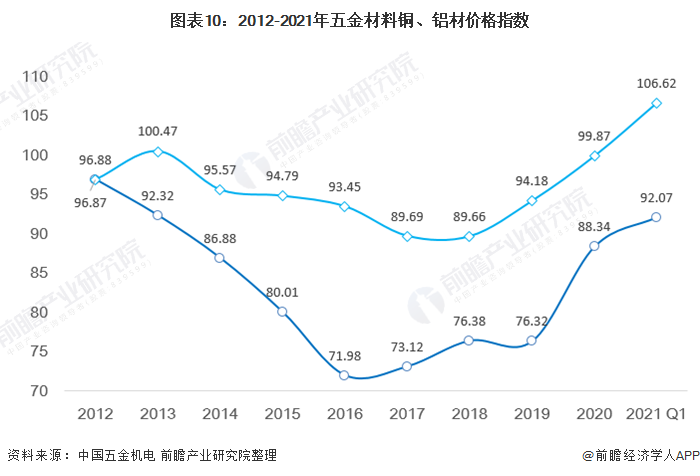
Note: The copper price index is above, and the aluminum price index is below.
4. Downstream development of dry-type transformer industry in China: the main application fields are electric power and rail transit, and the high-frequency transformer field is a new development field.
— — Power construction: the overall balance of power supply and demand in China
From 2011 to 2020, the electricity consumption of the whole society will increase year by year. In 2020, the electricity consumption of the whole society will be 7.51 trillion kWh, up by 3.95% year-on-year, and the power supply and demand situation in China will be generally balanced. With the effective control of the epidemic and the gradual implementation of the country’s counter-cyclical control policies, the resumption of work, production, business and market has continued to achieve remarkable results, and social electricity consumption has steadily recovered.

At the end of 2019, in the "Notice on Further Strictly Controlling Power Grid Investment" issued by China, it was clearly put forward that the output should be fixed, the scale of power grid investment should be strictly controlled, efficiency and benefit should be focused, and power grid investment management should be strengthened. This move marks the official end of the era of large investment in power grid. In 2020, State Grid will continue to reduce grid investment.
From 2015 to 2018, the investment in power supply projects in China showed a downward trend, and it began to pick up in 2019. In 2019, the investment in power supply projects of major power generation enterprises nationwide was 313.9 billion yuan, up 12.6% year-on-year. According to the statistics of China Electric Power Enterprise Association, in 2020, the investment in power supply projects in China will further increase to 524.4 billion yuan.

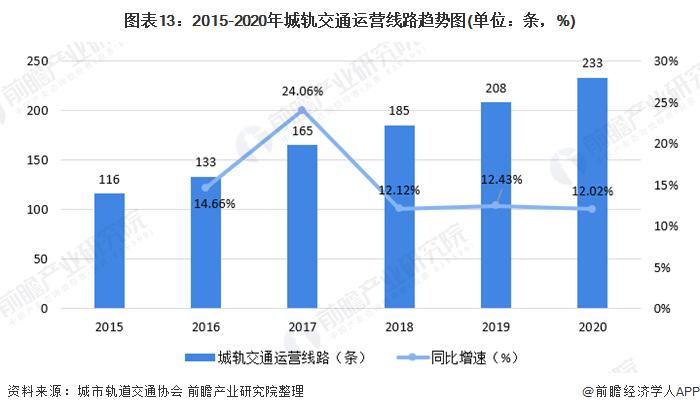
2) Rail Transit: The operation lines of urban rail transit are on the rise.
From 2015 to 2020, the operation lines of urban rail transit are on the rise. According to the statistical annual report data of Urban Rail Transit Association, in 2020, 44 cities across the country (excluding Hong Kong, Macao and Taiwan) opened 233 urban rail transit lines and added 39 urban rail transit lines.
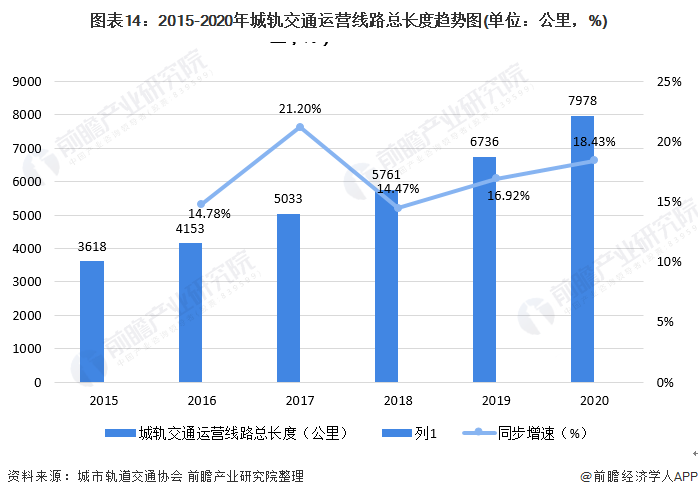
From 2015 to 2020, the length of urban rail transit lines in China will increase year by year. According to the statistical annual report data of Urban Rail Transit Association, in 2020, 45 cities in China mainland have opened 7,978.19 kilometers of urban rail transit lines, an increase of 18.43% compared with 2019.
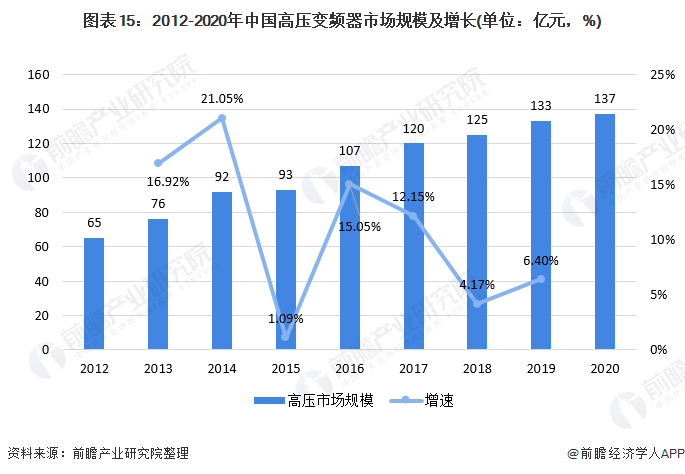
3) High-frequency transformer: In 2020, the market scale will be nearly 14 billion yuan.
High-voltage frequency converters can be subdivided into two series: universal high-voltage frequency converters and high-performance high-voltage frequency converters. Their application fields involve electric power, mining, cement, metallurgy, petrochemical and other industries. They can realize soft start, intelligent control, speed regulation and energy saving of various loads such as fans, pumps, air compressors, hoists and belt conveyors driven by high-voltage motors, thus effectively improving the energy utilization efficiency, process control and automation level of industrial enterprises.
Among them, the universal high-voltage inverter mainly realizes the purpose of energy saving by adjusting the motor speed, and is mainly used in the drive control of fans and pumps in the fields of electric power, mining, metallurgy, cement and so on. By using vector control and energy feedback technology, high-performance high-voltage inverter has the characteristics of constant torque, fast dynamic response, high speed regulation accuracy, wide speed regulation range and fast braking compared with general high-voltage inverter, and can realize energy feedback to the power grid when load braking. High-performance high-voltage inverter is suitable for high-end fields such as mine hoist traction frequency conversion, rolling mill frequency conversion drive, ship drive and high-speed locomotive owner drive.
China’s high-voltage inverter market has maintained a high growth rate. From 2012 to 2020, the market scale of high-voltage inverter will continue to grow, and the growth rate will fluctuate. Judging from the downstream performance of power, building materials and rail transit and the negative impact of epidemic superposition, the growth rate of downstream application demand in 2020 is less than that in 2019, and the growth rate will slow down. In 2020, China’s high-voltage inverter market will reach 13.7 billion yuan, with a growth rate of 3.0%.
5. Analysis of the development status of dry-type transformer industry in China.
— — Supply side: the number of enterprises has a downward trend, and the output has dropped.
In terms of output, the output of dry-type transformers in China expands with the expansion of the capacity of transformer industry in China. From 2013 to 2018, China’s dry-type transformer output fluctuated. In 2019, the national dry-type transformer output maintained a slight increase, reaching 273 million KVA. root
According to interviews with people in the industry and authoritative experts, the output of Jinpan Company will reach 20.12 million KVA in 2020. According to the fact that the company’s dry-type transformer output will account for 7.7%-7.84% of China’s dry-type transformer output in 2018-2019, it is predicted that the output of Jinpan Intelligent Technology dry-type transformer will account for about 8% of the total industry output in 2020. Based on this calculation, the output of dry-type transformers in China will be about 251.5 million kva in 2020.

2) Demand side: Dry-type transformers account for about 15% of the transformer industry market.
At present, dry-type transformers account for about 10%-15% on average in ordinary cities, and about 50% in Beijing, Shanghai, Guangzhou, Shenzhen and other cities. However, due to the relatively small application of dry-type transformers in rural distribution networks in China, dry-type transformers account for 15%-20% of transformer applications as a whole.
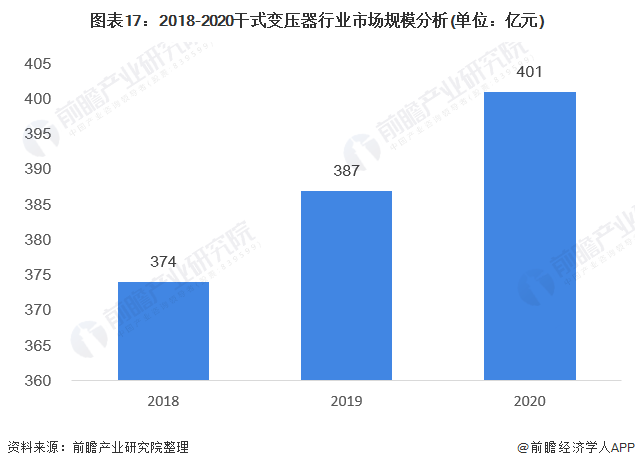
In 2018, the sales revenue of China’s transformer industry was about 249.1 billion yuan, and in 2019, the sales revenue of China’s transformer industry was 258.1 billion yuan. Based on the calculation that dry-type transformers account for 15% of the transformer industry market, in 2018 and 2019, the sales revenue of dry-type transformers in China was 37.4 billion yuan and 38.7 billion yuan respectively.
It is preliminarily estimated that the sales revenue of China’s transformer industry will be about 267.1 billion yuan in 2020. Based on the calculation that dry-type transformers account for 15% of the transformer industry market, the sales revenue of China’s dry-type transformer industry will be about 40.1 billion yuan in 2020.
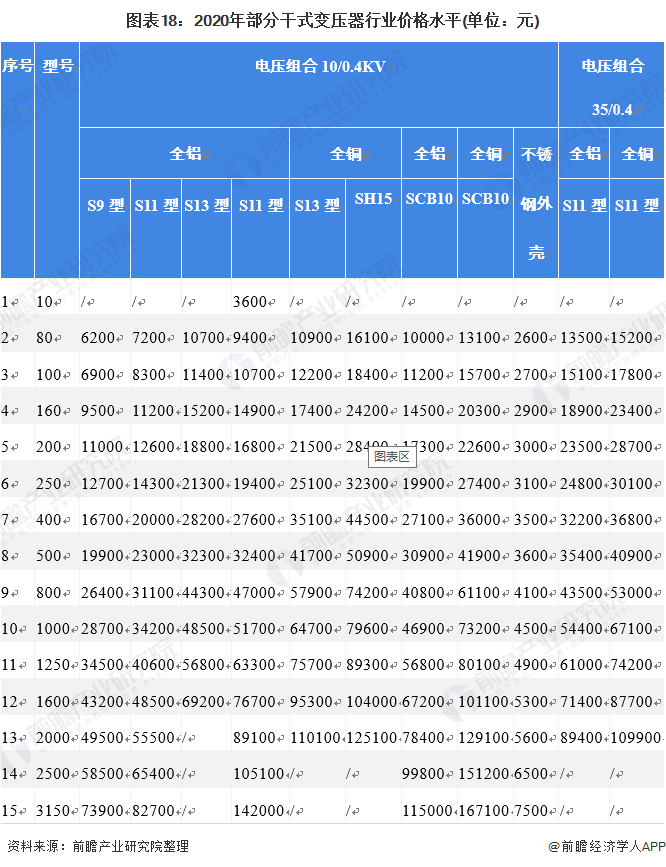
3) Price: related to available voltage and materials.
The prices of dry-type transformers are differentiated according to different materials and voltages. In 2020, the prices of some products of dry-type transformers are shown in the following table:
6. Analysis of market competition pattern of dry-type transformer in China.
— — Regional competition pattern: development concentration in East China
In China, dry-type transformers currently account for a relatively high proportion in large and medium-sized cities, and their application in rural power distribution networks in China is relatively small, accounting for about 50% in cities such as Beijing, Shanghai, Guangzhou and Shenzhen. Zhejiang Province is the most concentrated industrial area of dry-type transformers in China, followed by Jiangsu Province, Shandong Province and Guangdong Province. It can be seen that East China is the best area for the development of dry-type transformer industry at present.

2) Competition pattern of enterprises: There are four camps, and fewer enterprises can produce 110kV dry-type transformers.
Transformer is an essential transmission and distribution equipment in power generation industry, and its demand is closely related to the investment scale of power grid. On the whole, the competition in China transformer industry is fierce, the number of domestic transformer manufacturers is also growing rapidly, and the competition in the low-end transformer market is fierce. In recent years, the rapid development of new energy power generation industry has brought better development space for transformers, and it has also become an important direction for transformer manufacturers to seize market segments and expand their business scope.
Transformer enterprises in China can be divided into four camps: ABB, AREVA, Siemens, Toshiba and other multinational group companies have formed the first camp with technical and management advantages, occupying 20%-30% market share;
Large domestic enterprises, such as Bao Bian, Te Bian and Xi Bian, occupy 30%-40% market share by upgrading the technical level and grade of their products, forming a second camp;
The manufacturing enterprises represented by Jiangsu Huapeng Transformer Co., Ltd., Qingdao Qingbo Transformer Co., Ltd., Shunte Electric Co., Ltd., Shandong Dachi Electric Co., Ltd. and Hangzhou Qianjiang Electric Group Co., Ltd. formed the third camp;
Many private enterprises have formed a certain market share and formed the fourth camp because of their flexible management mechanism and no unproductive burden.

Judging from the development of major dry-type transformer enterprises at present, there are few enterprises that can produce 110kV dry-type transformers, and most of them are 35kV (38.5kV under high voltage). Among them, Jiangsu Huapeng Transformer Co., Ltd. and Shandong Jinmanke Electric Group Co., Ltd. are the few domestic enterprises that can produce 110kV dry-type transformers.
Jiangsu Huapeng Transformer Co., Ltd. successfully developed the world’s first 40000kVA 110kV dry-type transformer in March 2020, and its performance level reached the international leading level.

7. Development prospect and trend forecast of dry-type transformer industry in China.
— — "One Belt, One Road" Power Cooperation Trend
At present, the per capita electricity consumption along the "Belt and Road" is far below the world average. Among them, the per capita electricity consumption in Central and Eastern Europe, Central Asia and the Middle East is relatively high, and South Asia is the lowest. In 2019, the per capita electricity consumption of countries along the Belt and Road Initiative was about 1,700 kWh/year, which was only about half of the world average (about 3,400 kWh/year).
Among them, the per capita electricity consumption in Central and Eastern Europe, Central Asia and the Middle East exceeds the world average; The per capita electricity consumption in South Asia is only 790 kWh/year. Along the "Belt and Road" is one of the regions with the fastest growth rate of electricity demand in the world in the next 20 years, with the fastest growth rate in South Asia and the slower growth rate in Central and Eastern Europe and Central Asia.
From the scale of new investment, renewable energy power generation will surpass traditional fossil energy power generation. Consistent with the overall trend of power development in the world, low-carbon and clean-up are also the development directions of the "Belt and Road" power, and most countries along the "Belt and Road" have formulated policies related to low-carbon transformation of power generation. It is estimated that the investment in new renewable energy power generation along the "Belt and Road" in 2019-2040 will be 37% more than that in fossil energy power generation.
Judging from the newly installed capacity, both wind power and hydropower exceed each other. In view of the rapid decline in the cost of wind power and solar energy, and the development of hydropower is greatly constrained by environmental protection, immigration and other issues, the newly installed capacity of solar energy and wind power along the "Belt and Road" will be larger than that of hydropower in the next 20 years, which is also consistent with the global development trend.
The construction of transnational power grids along the "Belt and Road" has begun to take shape, but the degree of interconnection of transnational power grids is still slightly lower than the world average. In the next 20 years, the scale of power grid investment along the Belt and Road Initiative will be 2.58 trillion US dollars, accounting for 42% of power investment. Among them, the investment scale of South Asia Power Grid is the largest, with 1.11 trillion US dollars, followed by Southeast Asia, Central and Eastern Europe, Central Asia and the Middle East.
Southeast Asia’s power grid investment accounts for the highest proportion of power investment, reaching 53%, while other regions are less than 50%. Among them, the transnational interconnection lines along the Belt and Road are an important part of power grid investment.

2) Opportunities brought by the increase of electricity price to power grid construction
In recent years, the state has adjusted the benchmark grid price and sales price of coal-fired power generation in many provinces, canceled the collection of special funds for industrial enterprise structure adjustment from power generation enterprises, and reduced the collection standards of national major water conservancy project construction funds and large and medium-sized reservoir resettlement support funds by 25% each.
The new income obtained by power grid enterprises will be mainly used in the following three aspects. First, make up for the environmental cost increase factors such as energy saving and emission reduction, including the increase of desulfurization cost. Second, it is used for the renovation expenditure of residential users’ electricity meters. In the future, in the process of "one household, one meter" transformation, power grid operating enterprises shall not charge residential users for the transformation of electric meters.
In addition, the new income obtained by power grid enterprises may also be used to make up for the increased power purchase cost of power grid enterprises due to rising fuel costs.
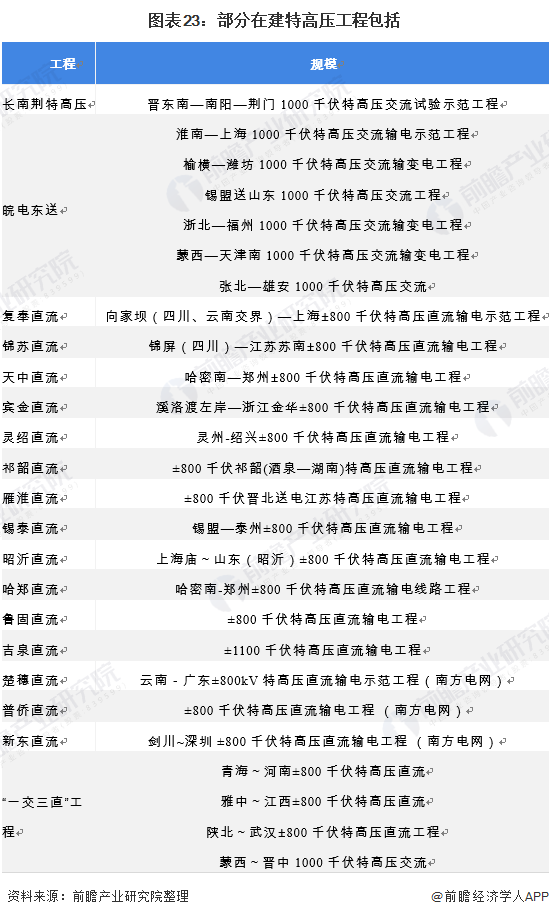
3) UHV has become the focus of power grid construction, and the demand for high-end transmission and distribution equipment has surged.
State Grid released the action plan of "peak carbon dioxide emissions, Carbon Neutralization", and proposed that 18 measures will be taken in the future to contribute to the realization of "peak carbon dioxide emissions, Carbon Neutralization", among which the continued construction of UHV transmission of clean energy is one of the measures. At present, the UHV channel has been gradually fully delivered, increasing the transmission capacity by 35.27 million kilowatts; It is planned to build 7 UHVDC circuits, with an additional transmission capacity of 56 million kilowatts. Together with the UHV transmission capacity built in the southern power grid area, the UHV transmission capacity is expected to exceed 100 million kilowatts at the end of the 14th Five-Year Plan.
Generally speaking, we are optimistic about the approval of UHV planning, and UHV is expected to really enter the construction peak in the next few years on the premise of frequent power shortages in a wide range, high-end equipment manufacturing supported by the state and high certainty of overall investment in power grid.
4) The output and sales amount of dry-type transformers in China will continue to rise.
In recent years, with the acceleration of urban and rural power grid construction, China’s power generation and electricity consumption are increasing day by day. Usually, for every 1kW of power generation, the total transformer capacity of 11kVA needs to be increased; Among them, the distribution transformer accounts for about 1/3-1/2 of the total capacity of all transformers. It is estimated that dry-type distribution transformers account for about 1/5-1/4 of all distribution transformers, and as a whole, including the application of power distribution transformers, the proportion of dry-type transformers in transformers in China is between 10 and 15%.
In recent years, due to the investment in power grid construction, the market prosperity in the field of power transmission and distribution has increased, and the output of transformers and dry-type transformers will show a rising trend. However, due to the high capacity base of transformers in China, the growth rate will show a relatively stable state. From 2013 to 2019, the compound growth rate of dry-type transformer output is 5.50%, which is special in 2020 due to epidemic situation.
It is predicted that the output of dry-type transformers will continue to grow in the future. It is predicted that by 2026, the output of dry-type transformers in China will exceed 324.1 million kva. It is estimated that by 2026, the industry sales revenue will be about 56.7 billion yuan.

Please refer to Foresight Industry Research Institute for the above data and analysis. At the same time, Foresight Industry Research Institute also provides industrial big data, industrial research, industrial chain consultation, industrial atlas, industrial planning, park planning, industrial investment attraction, IPO fundraising feasibility study, prospectus writing and other solutions.