Cctv news: "(epidemic prevention and control, resumption of work and resumption of production) It is very difficult to grasp both hands and be hard with both hands." Meng Gang, director of the Zhejiang Development and Reform Commission, said in an interview on February 20th, "But we in Zhejiang have the confidence, and the confidence comes from our ‘ One map, one code, one index ’ 。” The "one map, one code and one index" here refers to three "magic weapons" offered by Zhejiang relying on big data: five-color map of epidemic situation, personal health code and precise intelligent control index. Not only in Zhejiang, many places also use big data to escort the resumption of work and production.
Zhejiang+Big Data = One Map, One Code and One Index
On February 13th, in Hangzhou, Mao Cangpeng, a volunteer from Wenhui Street in Xiacheng District, was on duty at the subway station, and he recognized a yellow code rework worker, which means that the rework worker needs to be isolated at home for 7 days before he can officially return to work. The 13th is the first day of the official promotion of "Health Code" in Hangzhou. Facing the major test of epidemic prevention and control brought by the return of nearly 5 million people to Hangzhou, the implementation of "Health Code" has greatly improved the accuracy and efficiency of community epidemic prevention.
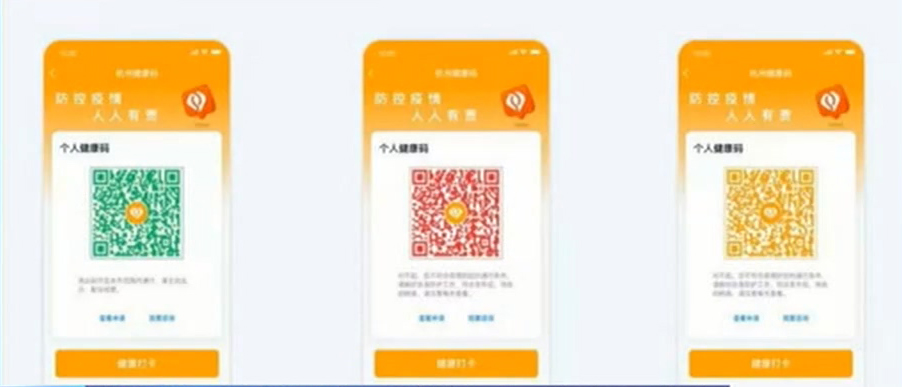
There are three kinds of "health codes": the green code can directly enter Hangzhou, the red code is isolated for 14 days, and the yellow code is isolated within 7 days. The "health code" management information system in Zhejiang Province is based on real data, connected with relevant databases such as the dynamic control list of key personnel, and distributed "health codes" according to the check and comparison results of the mass declaration information and background data. By the 20th, Zhejiang had issued more than 33 million "health codes", with a green code rate of over 96%.
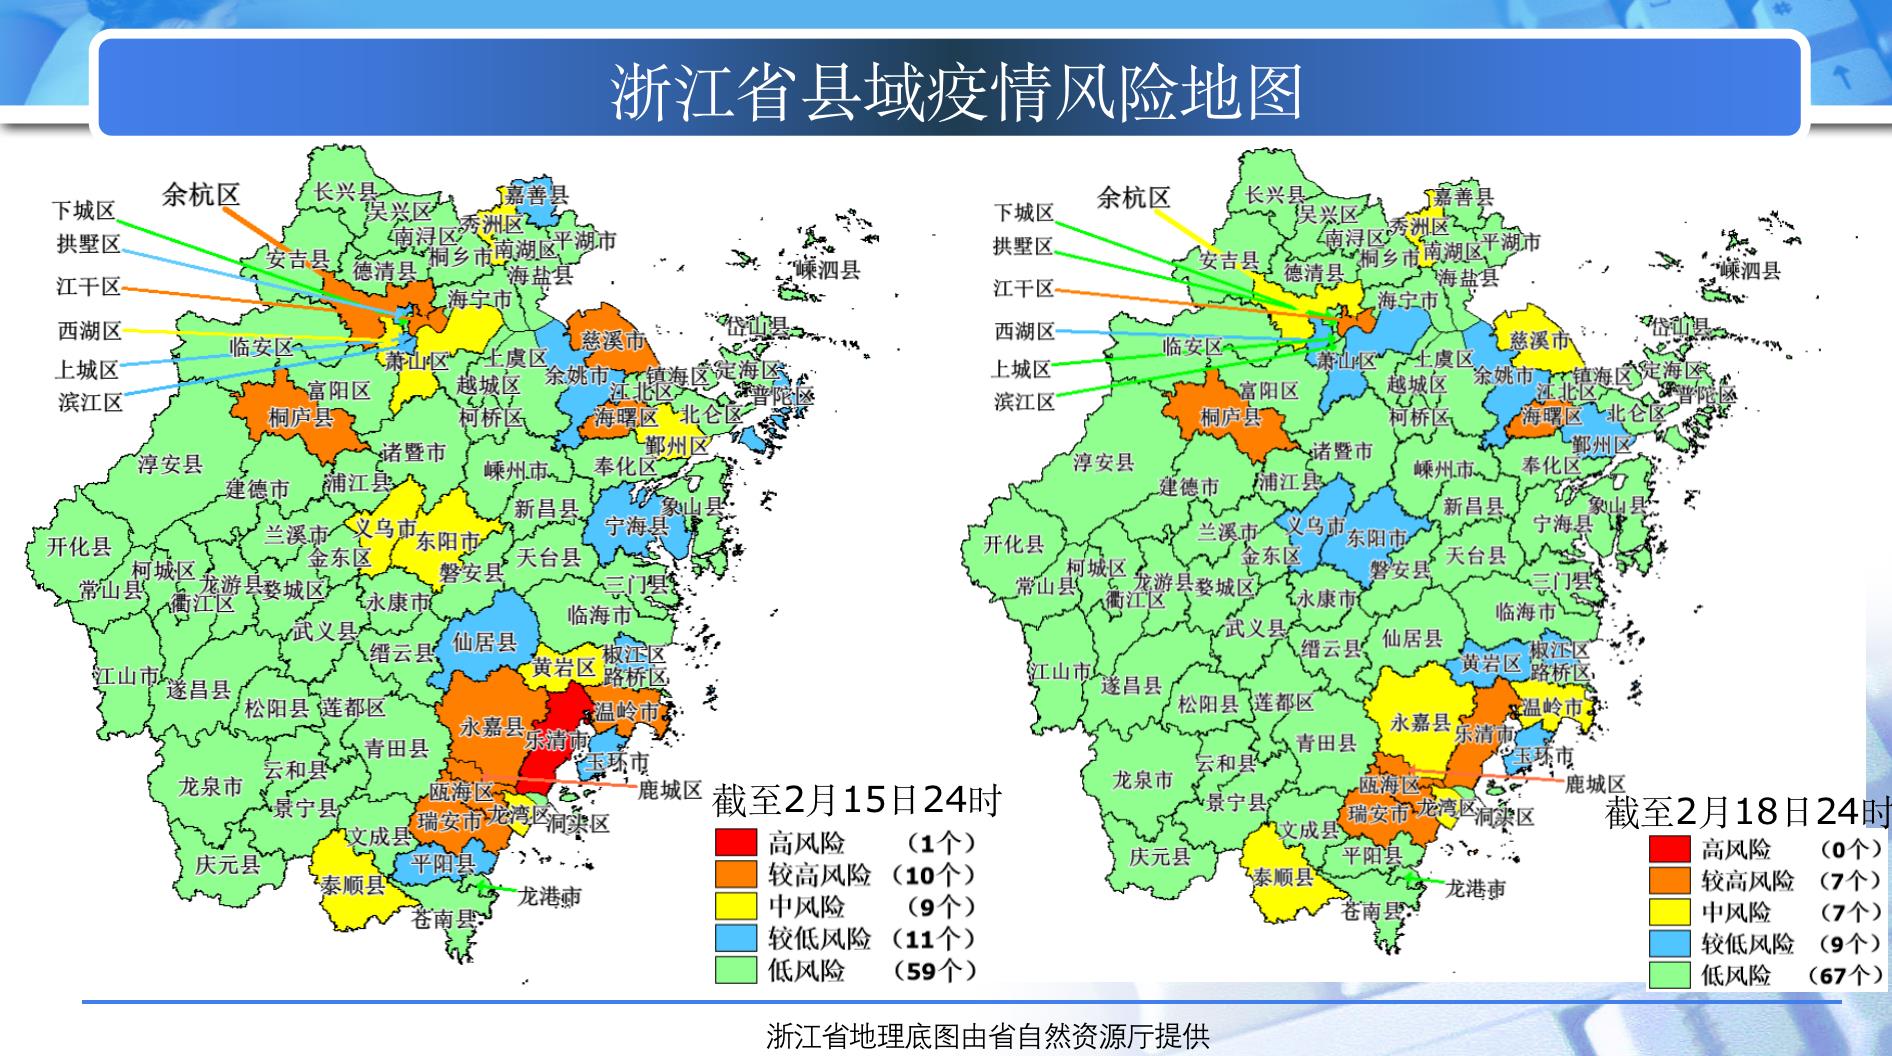
At the same time, the red, orange, yellow, blue and green five-color "epidemic map" drawn according to the risk level has become a "staff map" for hierarchical management and control, and it is designed and released dynamically according to indicators such as the number of newly diagnosed cases and the incidence of agglomeration in each region. The "precise intelligent control index" consists of a control index consisting of five indicators, including new case control, and a smooth index consisting of seven indicators, including bus opening rate.
Beijing+Big Data = Digital Epidemic Prevention System
Also relying on "internet plus Big Data", Beijing Economic and Technological Development Zone recently launched the "Golden Shield of War and Epidemic" system.

The system has two modules: personal health report and institutional information report. Enterprises and residents can enter the corresponding modules according to the actual situation. After entering the information, they can generate an exclusive two-dimensional code. With this exclusive two-dimensional code, they can quickly enter communities, buildings or enterprises as long as their body temperature is measured.
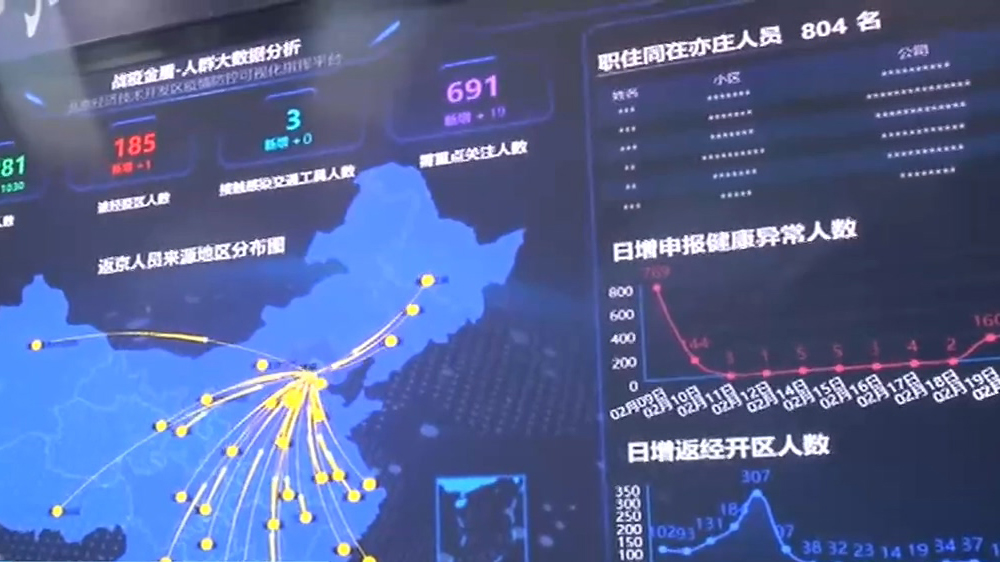
At the same time, through the "Golden Shield of War and Epidemic" system, the basic information of all kinds of people in Beijing Economic and Technological Development Zone and the flow distribution of people returning to Beijing will be gathered into a visual data analysis to realize epidemic prevention, traceability and tracking. According to Zhang Jun, executive deputy director of the Propaganda and Culture Department of the Working Committee of the Development Zone, "This system has gathered the health information of nearly 40,000 residents in all communities within its jurisdiction and the real-time data of 1,098 enterprises above designated size. In addition to accurately empowering epidemic prevention and control, this system is conducive to our production and epidemic prevention, and will also make great achievements in social governance. "
Sichuan+Big Data = Power Index of Enterprises Returning to Work
Coincidentally, the State Grid Sichuan Electric Power Company recently released an analysis report entitled "Daily Monitoring Report on Power Index of Sichuan Enterprises’ Resumption of Work and Production", which uses the data of hundreds of thousands of users in various industries and regions in the province to analyze the electricity consumption of enterprises in the province and form the power index of enterprises’ resumption of work.
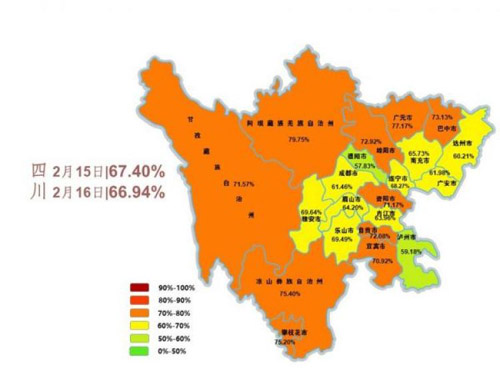
Distribution map of resumption of work by city and state as of February 16th.
The power index of enterprises’ resumption of work is an index formed by the power department by collecting the electricity consumption data produced by enterprises every day, comparing it with the electricity consumption during normal production in the history of enterprises, and analyzing it with big data, which can not only objectively and accurately reflect which enterprises have resumed work, but also reflect how much production capacity the enterprises have resumed. As of February 19th, Sichuan Electric Power Big Data has achieved real-time collection of electricity consumption data of 113,100 industrial and commercial users, and the cumulative daily processing number of the system exceeds 300 million.
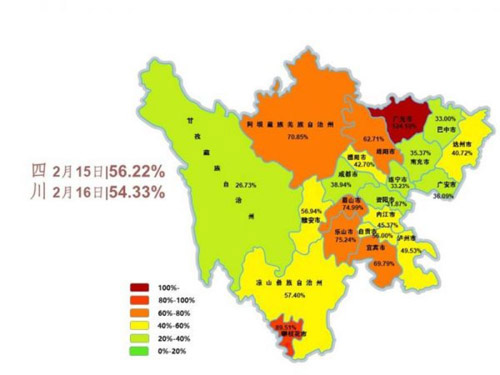
Distribution map of resumption of production by city and state as of February 16th.
At the same time, State Grid Sichuan Electric Power also monitors the electricity consumption of nearly 200 designated hospitals in COVID-19 in real time. Once there is a hidden danger that may lead to power failure, it can dispatch personnel to eliminate it in time. (Text/Xie Botao)